Archive for Effective Application Monitoring Solutions

The Five Elements of Physical Component Application Monitoring

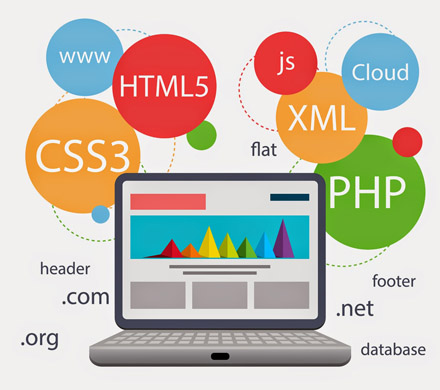
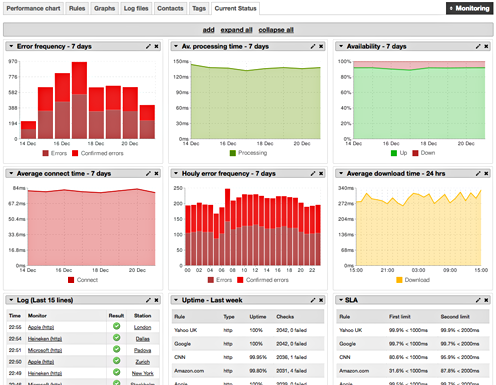
When it comes to effective application monitoring, there are literally hundreds of various metrics you could monitor. Of course, the exact metrics you choose to monitor directly depends on the use and complexity of your Web application. However, with this mind, there are several fundamental metrics all administrator’s should monitor. The following five elements of effective application monitoring on the physical components of your application network all play a direct role in the performance, stability and reliability of your Web applications.

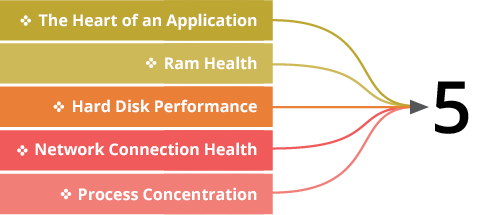
The Five Elements of Application Monitoring Metrics

The-Five-Elements-of-Application-Monitoring-Metrics

If you desire to establish an application that’s free from a performance issues and errors that may hinder your online success and reputation, then take a moment to explore the following five elements of effective monitoring for application physical components.

  • The Heart of an Application – Perhaps the most important physical component to monitor within your application infrastructure is the CPU, or Central Processing Unit. This vital component literally controls the rest of the components within an application system. By understanding the performance of the CPU, the performance of other physical components is revealed. Remember, if your CPU is under-performing then the rest of the entire application infrastructure will suffer.
  • RAM Health – No, I’m not talking about a truck or cute mountain-side dwelling creatures, but rather the Random Access Memory of your application. All Web applications utilize physical memory as a temporary storage area. The program files stored within the RAM drive are those that are commonly accessed by the CPU. Therefore, the greater your RAM storage, the faster your CPU will perform, which ultimately increases the speed and functionality of your applications.
  • Hard Disk Performance – The importance of a high-performing hard disk is nothing new to many application developers. There are many elements that influence the overall performance of your application; however, few have quite the level of influence as hard disk performance. If the hard disk becomes too full, the entire operation will suffer. Therefore, it’s imperative that when you monitor web applications your software is capable of predicting future capacity issues so administrator’s are capable of adjusting resources or upgrading hard disk storage capacity.
  • Network Connection Health – Although the aforementioned system metrics are essential for a full-functioning application, if these components are unable to communicate with other physical and virtual components through its network, then your CPU utilization rate doesn’t matter. Therefore, in order to establish a healthy application you must establish several network connection monitoring agents to keep track of communication levels.
  • Process Concentration – As applications grow and become more advanced, so does the number of processes, or transactions. While most advanced computer systems are able to handle multiple processes at once, there is a limit to the number of threads utilized by your applications. Application monitoring solutions are able to not only monitor the health of these threads, but also notify administrator’s should the number of threads (or processes) outweigh the capabilities of a current system.

Effective Web Application Monitoring via Multi-Tiered Techniques

web-applications-image-1-3

Regardless of the purpose of your website, and its included applications, the number one concern for all developers and administrator’s is fostering a stable and high-performing environment for end-users. Without continuously striving for a positive end-user experience, your application performance and stability could dramatically suffer. As the complexity of applications continues to grow, the need for advanced-level monitoring capabilities simultaneously increases. A current trend within the application industry is the development of multi-tier application architecture.

Multi-Tier Application Infrastructure Explored

In the most fundamental sense, a multi-tiered application is one that communicates with more than one component in order to execute a variety of tasks. For example, a common application architecture involves an end-user interacting with a client application to access a Web application. As the user engages the Web application, the application opens queries with a designated database, which then must work simultaneously with Web servers to sustain the communication. As the request is processed in the database, the resulting information is transferred back to the user’s Web browser.

In some cases, one application may need to interact with other applications in order to satisfy a user request, such as gathering prices from multiple sources. When this happens, the primary application must balance its workload across multiple databases and servers without experiencing a drop in performance or stability. While there are literally hundreds of design elements and codes responsible for executing these tasks, it’s imperative that the communication within each tier of an application is continuously monitored.

Therefore, one of the most effective means of monitoring these dynamic applications by implementing a monitoring solution capable of sending out hundreds of monitoring agents to multiple components within the entire application architecture. It would be physically impossible to manually sift through the amount of data these type of applications collect. Therefore, monitoring solutions are not only recommended, but practically required for these dynamic Web elements.

Throughout your quest to identify the best application monitoring solution for your multi-tier applications, it’s imperative to look for one that allows a combination of various monitoring techniques. There are free solutions, like web application monitoring by EveryStep Because the environment created by these complex application is unique, the need of multiple monitoring techniques, such as synthetic, real-user and transaction monitoring, is beyond essential. When comparing monitoring solutions, look for one that’s scalable in terms of its scope of monitoring as well as one capable of rendering complex data reports in an easy-to-understand format. It’s only by tackling these complex applications with even more complex monitoring solutions you’re able to sustain a stable and high-performing Web application.

Customizing Web Hooks for Powerful Application Monitoring and Management

If you’ve browsed articles or how-to books for establishing effective application monitoring techniques, then you’ve likely come across a topic known as “Web Hooks.” While you may be familiar with this topic, do you truly understand how this somewhat simple feature can dramatically alter the effectiveness of your application monitoring solution? Because the majority of Web applications now utilize dynamic and complex infrastructure communications and processes, it’s essential that each of these components are effectively monitored for stability and performance. Unfortunately, it would take hours, days or even weeks to review and determine the health of each of these elements. This is where application monitoring Web Hooks come into play.

What is a Web Hook?

In the most fundamental sense, a Web Hook is a series of actions that are triggered when a user performs a specific action or when the application undergoes a specific action. For example, a user enters his email information to subscribe to a newsletter. Unfortunately, the user’s information is not processed correctly and the user experiences an error page. Immediately upon noticing this event, the Web Hook automatically gathers information from the session and sends this information to the application administrator while simultaneously sending the user to a specific error page. To find errors in a process like this, you need use monitoring tool. Something like Everystep Automation, or even a browser automation tool or other various solutions might work.

As you can imagine, there is literally no end to the possibilities of these events, which make Web Hooks the ideal alert system for dynamic and complex applications as they can be set at any point within the infrastructure for any number of predictable and unforeseen events.

Creating Custom Actions Based Upon Events

Now that you have a basic understanding of Web Hooks and its ability to streamline communication between the application and its administrators, you must now delve into creating actions based upon specific events. The most important element to remember here is establishing a Web Hook for every major metric within your application. Although the metrics you must monitor can vary based upon the design and infrastructure of your application there are six universally important metrics that should be monitored via a Web Hook, which include:

  • CPU Usage Rate
  • Disk Usage Rate
  • Network Health
  • Application Transactions
  • Bottlenecks
  • Available Memory

Upon establishing a monitoring agent for each of these metrics, you must then customize a Web Hook action should the performance of each of these metrics fall above or below the established performance threshold. For example, should the CPU usage rate become too high, the Web Hook automatically opens a support ticket that is sent to the IT department of your enterprise while simultaneously sending out alerts to specific administrator’s or application developers.

screen-status